

The live stock levels graph provides valuable insights into the availability of properties within a specific area.
The graph is a valuable tool that provides an accurate snapshot of the property market within a specific postcode district or sector. Its visual representation and real-time data make it a powerful resource.
There is a key along the bottom of the graph to show how many bedrooms each colour represents.

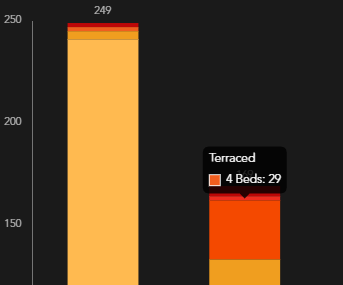
Hovering over the different colours on the show the property type, bedroom number and the number of properties on the market.
This graph shows all properties on the market within an area regardless of advertising agent.
If you have any questions or run into any issues, don't hesitate to reach out to our support team at customer.success@sprift.com or 0207 096 0847.
We're always here to help you get the most out of the platform.